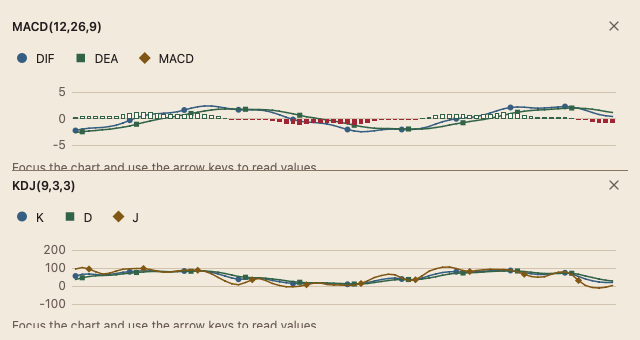
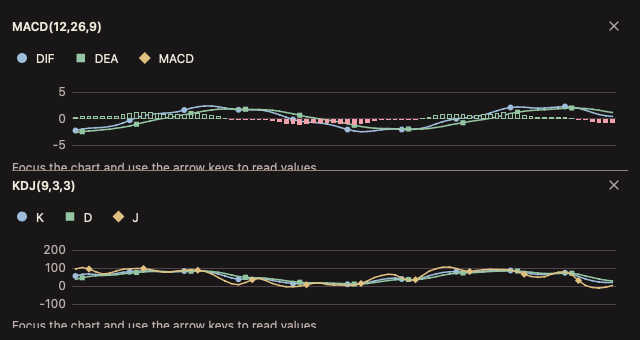
154 IndicatorPane
用途
副图 MACD、RSI、KDJ、OBV;多副图堆叠与高度调整。
最小示例
	at := time.Date(2026, 10, 5, 9, 0, 0, 0, time.UTC)
	candles := []chart.Candle{
		{Time: at, Open: 100, High: 103, Low: 99, Close: 102, Volume: 1200},
		{Time: at.Add(time.Hour), Open: 102, High: 104, Low: 100, Close: 101, Volume: 1600},
		{Time: at.Add(2 * time.Hour), Open: 101, High: 105, Low: 100, Close: 104, Volume: 900},
	}
	var window chart.MarketView
	panes := chart.IndicatorPanes{Panes: []chart.IndicatorPaneSpec{{Kind: chart.IndicatorRSI, Params: []float64{2}}}}
	view := func(c *ui.Context) {
		core.Use(c, core.Settings{})
		chart.IndicatorPane(c, candles, &window, &panes, chart.IndicatorPaneOptions{Height: 200, Label: "BTC"})
	}
	ui.Render(view, 640, 400, 1)
参数
Panes 为 MACD、RSI、KDJ、OBV 配置;Sizes 保存高度比例;Height 默认每副图 140 DIP,最小高度覆盖标题、图例、读数和 40 DIP 绘图区;Label 为无障碍名称前缀;Status、Error、Empty 设置等尺寸占位。
状态
浅深主题沿用窗口设置;交互组件遵循祖先 Disabled;调用方持有选择及展开状态。
事件
IndicatorPaneResult.Removed 为移除索引,默认 -1;Resized 表示高度调整完成;Point、Pane 为活跃读数和副图索引,PointChanged 表示读数变化。
键盘操作
Tab 聚焦图表;方向键移动数据读数并朗读;Home/End 到首尾;Escape 清除读数。主图与副图通过 +/- 缩放、Shift+左右方向键平移。
限制
数据由调用方提供;更新数据时替换切片,缓存按切片身份失效。行情读取、交易及持久化由调用方负责。