127 ChartAnnotation 图表标注
用途
在图表上显示水平线、垂直线、区间带和文字标注,可选择开启移动。
最小示例
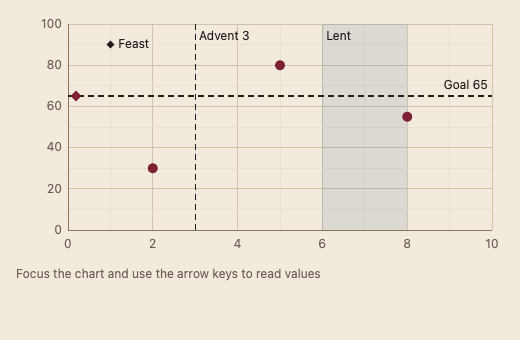
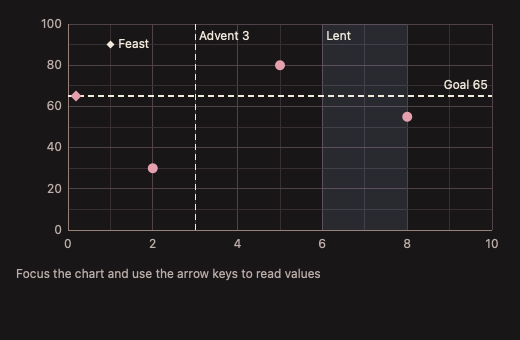
notes := []chart.ChartNote{{Kind: chart.NoteHLine, Value: 50, Text: "Goal", Draggable: true}, {Kind: chart.NoteBand, Value: 6, End: 8, Text: "Lent"}}
view := func(c *ui.Context) {
	core.Use(c, core.Settings{})
	x := chart.ChartAxis(c, chart.ChartAxisOptions{Max: 10})
	y := chart.ChartAxis(c, chart.ChartAxisOptions{Side: chart.SideLeft, Max: 100})
	annotation := chart.ChartAnnotation(c, notes, chart.ChartAnnotationOptions{X: &x, Y: &y})
	box := ui.Box(c).Fill().Focusable().Label("Annotations")
	b := box.Bounds()
	annotation.Drag(box, ui.Rect{X: 60, Y: 20, W: b.W - 80, H: b.H - 60})
	box.Draw(func(p *ui.Painter, r ui.Rect) {
		plot := ui.Rect{X: r.X + 60, Y: r.Y + 20, W: r.W - 80, H: r.H - 60}
		x.Draw(p, plot)
		y.Draw(p, plot)
		annotation.Draw(p, plot)
	})
}
ui.Render(view, 400, 300, 1)
参数
notes []ChartNote:Kind 默认为 NoteHLine;Value 是水平线 Y 或其他标注 X;End 是带末端 X 或文字 Y;Text 是文案;Draggable 默认 false。X, Y 均必填;坐标必须有限,带需要 End > Value,文字需要非空 Text。
状态
先绘制区间带,再绘制线和文字;可移动线带有菱形手柄。祖先禁用阻止移动。
事件
Drag(element, plot) 处理指针和键盘,修改原切片并返回是否发生变化。Draw 绘制当前标注。
键盘操作
Tab 聚焦宿主图表;Alt+PageUp/PageDown 选择可移动标注;Alt+方向键每次移动轴跨度的 1/100。选中说明和变化会被朗读。
限制
Drag 的 plot 是元素局部坐标;Draw 的 plot 是窗口坐标。标注切片由调用方持有;移动后调用方负责业务保存。